Monthly Archives: November 2014

Raindrops

Sometimes math can be completely useless, but amazingly simple and beautiful…

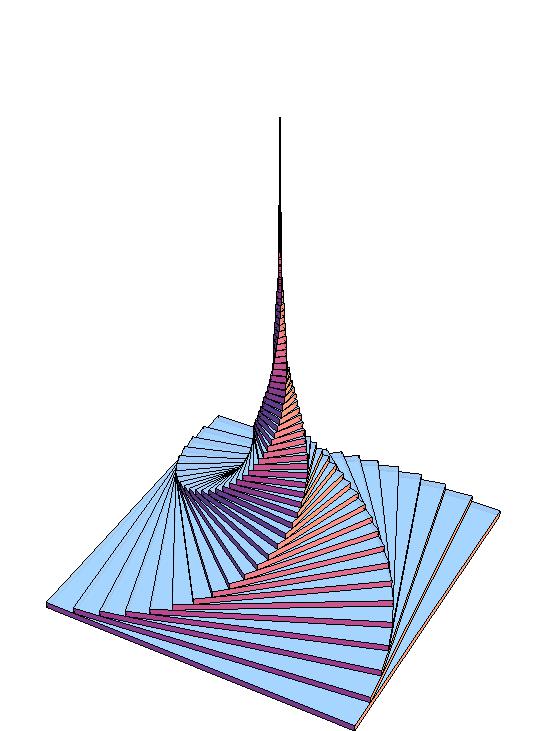
Another possible example of this fact is the following animation , that could be created with a very short code in Wolfram Mathematica (just 221 characters in total):

Animate[With[{r := RandomReal[]}, 
  Graphics[BlockRandom[
    Table[With[{z = r}, {, GrayLevel[2 (t - z)], 
       Thickness[0.03 (0.20 - t + z)], 
       Circle[{1.7 r, 0.82 r}, Max[0, t - z]]}], {k, 1, 45}]], 
   PlotRange -> {{0, 1.7}, {0, 0.82}}]],
{t, 0, 1}, DefaultDuration -> 20]

Too much long to be posted in in the twitter @wolframtap (Wolfram Tweet-a-Program). But short enough to show how some basic mathematical ideas can be very simple and yet beautiful (even if, maybe, useless). Here’s the video posted on youtube:

A twisted Eiffel tower (useless but beautiful math)

Sometimes math can be completely useless, but amazingly simple and beautiful.
A possible example of this is the following image, that could be created with a twitter-sized code in Wolfram Mathematica (123 characters in the present case):

Graphics3D[Table[Rotate[Cuboid[{-0.9^k, -0.9^k, (1/20)*k}, 
{0.9^k, 0.9^k, (1/20)*(k + 1)}], k*0.1, {0, 0, 1}], {k, 0, 60}]]

EiffelThis mini-program was published (and favorited) in the twitter @wolframtap (Wolfram Tweet-a-Program).

Here‘s the twit.

Another interesting thing about the fancy building depicted in the image is that, although it might have infinite height, it’ll still have a finite volume.

There’s also a small extension in this interactive demonstration (in which it’s possible to change the angle between consecutive parallelepipeds.

(Thanks to BV for suggesting me this beautiful idea)

Waves propagation: the space view and the time view

It’s not easy to understand the mathematical inner workings of moving waves.
That’s because a wave is a perturbation in a media that changes with space and time.
So, even in the simplest case (i.e. waves propagating in a 1-dimensional media like a string) there are at least three variables involved: amount of the perturbation, position and time.

To understand better the relations between those variables and the wave parameters I’ve created, with the software Wolfram Mathematica, an interactive demonstration about moving waves. The demonstration has been exported in the .cdf format so that it can be interactively used with the free CDF Player (see here how to install it).

The CDF demonstration is available at this page.

It will show 4 different views;

• The moving wave
• The time view at a fixed position (x_0)
• The space view at fixed times (when the flash comes)
• The 3D view, in which there is also the moving point representing the state of the perturbation at x_0 as time goes by and its space-time trajectory.

In the demonstration it will be possible to change the wave parameters and see how its dynamic evolution changes accordingly.
For those who don’t have the free CDF Player installed on the PC (or those visiting this site from a a smartphone/tablet iOS/Android) here is a short video preview of the demonstration: